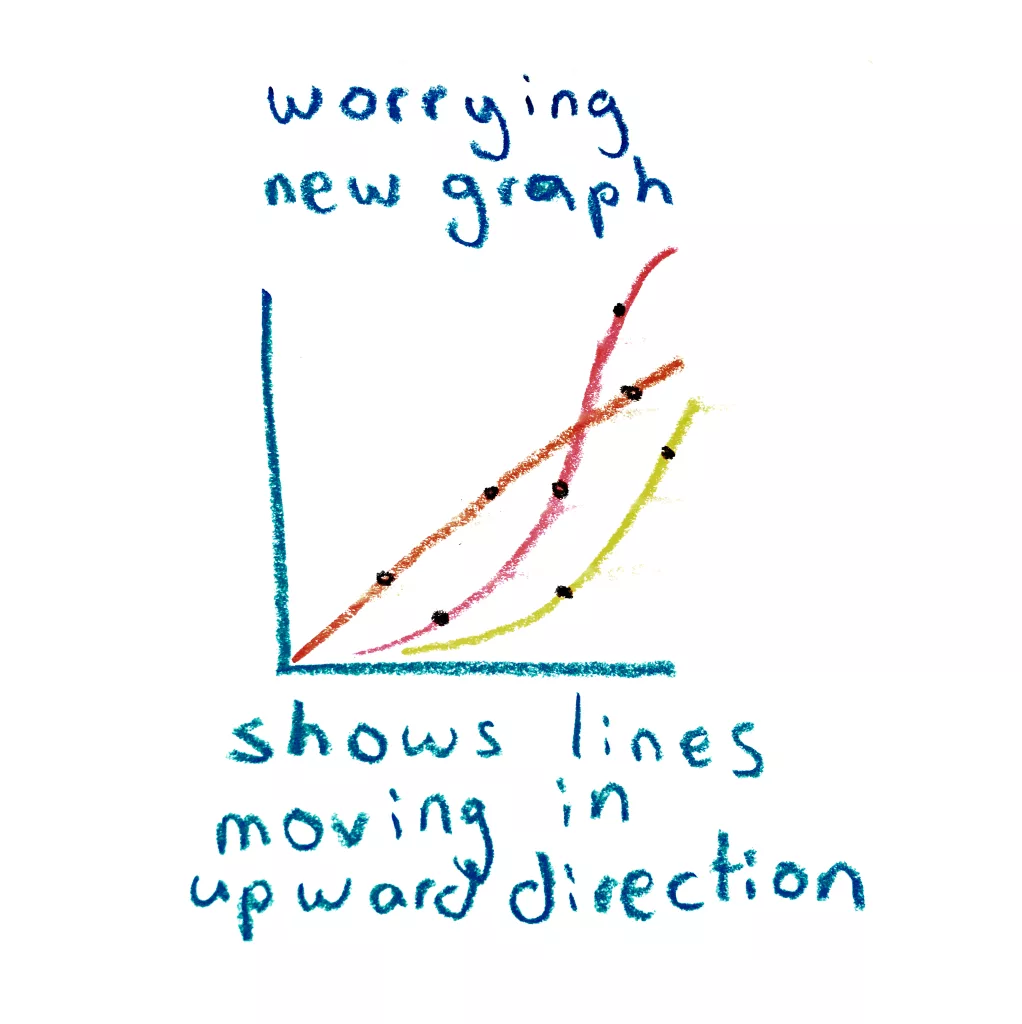
i drew this during peak rona in april 2020 when there would be all these graphs of various sorts on the news and no one would really understand things but everything was “up, up, up” and every graph was “worrying”

i drew this during peak rona in april 2020 when there would be all these graphs of various sorts on the news and no one would really understand things but everything was “up, up, up” and every graph was “worrying”